Over the weekend, geopolitical tensions escalated meaningfully following coordinated U.S. and Israeli strikes on Iran, and subsequent retaliatory strikes by Iran.
First and foremost, we acknowledge the humanitarian consequences of this conflict and the loss of human life, which is tragic. However, as your financial advisor (and as investors ourselves), we must focus less on the headlines and more on the impacts on the financial markets.
In our view, the key variables that will have the most impact on financial markets are: (1) the scope and duration of the conflict, (2) the ability to ship oil through the Strait of Hormuz, and (3) the follow-on impact to oil prices – both in terms of the price level and persistence of elevated oil prices.
1) What’s already priced in (and what isn’t)
Markets did not enter this past weekend flat-footed. Energy prices had already been building in a geopolitical “risk premium,” with WTI Crude oil rising from ~$55 per barrel in December to ~$67 per barrel by last Friday (February 27).
Our focus on oil prices is because—historically—the biggest risk to equities and the economy tends to come not from the conflicts themselves, but from sustained energy price shocks that can reduce consumer purchasing power, slow economic growth, and compress corporate margins.
On Monday (March 2), the impact on oil prices was relatively muted with WTI Crude oil rising ~6% from Friday’s pricing. However, overnight WTI Crude oil spiked to ~$78 per barrel (intraday, as of this writing), which represents another 8.7% increase from Monday’s levels. This created significant volatility in the equity markets on Tuesday (intraday, as of this writing).
2) Oil’s impact on economic growth and inflation
While the spike in oil is to be expected and must be monitored closely, the more important issue is how long elevated oil prices will be sustained. As a practical rule of thumb, a $10 per barrel sustained price increase is estimated to reduce 2026 GDP growth by roughly 0.1% (with a larger drag if energy capex does not respond) and could lift inflation (headline) by roughly 0.2% to 0.3%. A shorter disruption in oil prices could result in a smaller drag on GDP of less than 0.05%.1 This is why the equity and bond markets are acutely focused on oil prices and will likely trade according to where oil prices trade over the short-term.
3) Strait of Hormuz: a real risk, but not a base case for prolonged closure
The major variable impacting oil prices today is the uncertainty regarding the Strait of Hormuz. Approximately 20% of global oil and gas supplies transit the Strait of Hormuz, making it an obvious focal point for U.S. and Iran, as well as investors around the world. History suggests that oil price spikes driven by geopolitical shocks can be short-lived if markets gain confidence that supply disruptions will be temporary. In other words, if investors believe the pressure on the Strait of Hormuz will be short-lived, then we expect the spike in oil prices to subside and volatility in the equity markets to calm.
Most geopolitical strategists argue that a sustained closure is difficult to execute for an extended period. The greater near-term risk is episodic disruption, higher insurance/security costs to ship oil, and a continued “security premium” embedded in energy prices—particularly for globally traded seaborne energy. Analysts believe that a partial slowdown lasting a week or two can be absorbed by oil companies, but a full or near-full closure lasting a month or more would push crude oil prices significantly higher.2
Separately, OPEC+ has already signaled a modest production increase (206k barrels per day), which may help reduce the odds of a disorderly spike if disruptions prove temporary.
4) Historical market behavior during conflicts
History doesn’t minimize the seriousness of war—but it does provide a helpful perspective on how markets tend to process geopolitical shocks. Since 1980, the average S&P 500 performance the day before the conflict, the day of the conflict, and the day after the conflict is +0.14%, 0.14%, and 0.00%, respectively.
Exhibit 1: How the Stock Market Typically Reacts to Geopolitical Conflicts
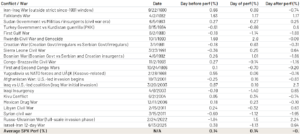
Source: Barclays
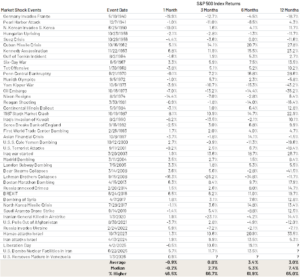
If we go back further and expand the time horizon for analyzing market performance, since 1940, on average, the S&P 500 performance on 1, 3, 6, and 12 months later after the start of a major geopolitical and historical event is -0.9%, 0.8%, 3.4%, and 3.0%, respectively.
Exhibit 2: How do stocks do after major events? – S&P 500 Index Performance After Geopolitical and Major Historical Events
Source: Carson Investment Research, S&P 500 Dow Jones Indices, CFRA, Strategas 02/20/2026
5) What we’re watching now (and how we’re positioned)
In the near term, volatility will likely continue—particularly if oil pushes materially higher and stays there. From a positioning standpoint, markets have already shown classic “conflict” crosscurrents: sectoral shift to energy and defense stocks, with broader equities holding up better than the headlines might suggest, and a flight to safe-haven assets like gold, U.S. Treasuries, and the U.S. dollar.
Our base case remains that the most consequential market risk would be a prolonged disruption that drives persistently higher oil prices, which could eventually pressure earnings and slow growth. At this stage, we do not view that as the most likely outcome—but we are monitoring developments closely and will adjust portfolios if the underlying fundamentals change.
As always, please reach out with questions or if you’d like to discuss your portfolio positioning in the context of these events.
Download a PDF version here.
1Goldman Sachs Research, March 2, 2026
2Neuberger Berman, March 3, 2026
Sanctuary Wealth makes no representation as to the accuracy or completeness of information contained herein. Any forward-looking statements are based on assumptions, may not materialize, and are subject to change without notice. The information is based upon data available to the public and is not an offer to sell or solicitation of offers to buy any securities mentioned herein. Any investment discussed may not be suitable for all investors. Investors must make their own decisions based on their specific investment objectives and financial circumstances. Investments are subject to risk, including but not limited to market and interest rate fluctuations. Any performance data represents past performance which is no guarantee of future results. Prices/yields/figures mentioned herein are as of the date noted unless indicated otherwise. All figures subject to market fluctuation and change. Additional information available upon request.