


Putting the Market Pullback in Perspective

Through today’s stock market close, the S&P 500 (SPX) was down 8.6% over the past week, the Dow Jones Industrial Average (DJIA) down 8.0%, and the Nasdaq Composite (COMP) down 10.0%. SPX, DJIA, and COMP are now 11.9%, 12.1%, and 18.4% off their 52-week highs.
Over the past week, the Cboe Volatility Index (VIX), rose from 19.30 to 37.74, a 95.5% increase. The VIX reflects how much investors expect the S&P 500 to fluctuate over the next 30 days. Moves of this size can be unsettling. We believe the economy and corporate earnings still give long-term investors good reason to stay patient.
Expected Volatility Rose This Week
 Source: Cboe Volatility Index, daily closes via Yahoo Finance. November 13 is the baseline for the week. Data from 11/19/2025 to 11/20/2026.
What Is Causing the Volatility?
In our November 5 commentary, we highlighted how the midterm elections could affect data center development. Proposed changes to permitting, electricity costs, and water use have left investors reassessing when some projects can move ahead. Investors are also asking whether future AI profits will justify today’s spending on chips, buildings, and power, particularly for companies borrowing to fund construction.
Two developments added to the uncertainty. On November 12, NVIDIA announced that co-founder Jensen Huang had resigned as CEO and that CFO Colette Kress would serve as interim CEO. Federal Reserve meeting minutes released November 18 raised the possibility of higher interest rates. Fed officials highlighted the rapid growth of AI-related debt and the difficulty of tracing some financing arrangements. Higher borrowing costs would make those projects more expensive before they generate revenue.
Markets are often said to take the escalator up and the elevator down. Increased leverage in the capital markets and algorithmic trading programs have increased volatility – both up and down. Algorithmic trading programs automatically sell as prices fall or volatility rises. Investors who bought with borrowed money (i.e., margin) may also have to sell to meet margin calls when stock prices fall. This tends to happen in tandem. When both groups sell at once, prices can fall sharply even if a company’s earnings outlook has changed little. This is defined as a dislocation in the stock market, and, over time, stock prices tend to revert to the true intrinsic value of the company.
Do We Expect This to Become a Bear Market?
A correction is defined as a decline of 10% or more. A market correction turns into a bear market once the decline is 20% or more.
We do not expect this correction to turn into a bear market. Corporate earnings and economic growth underpin our view. As of November 13, SPX blended earnings were +32.9% year-over-year (YoY) vs expectations of +29.1% YoY at the end of September. While analysts expect earnings to moderate to +28.9% in the fourth quarter, this is still very strong earnings growth. Analysts tend to underestimate earnings growth this far away from the next earnings season. Similarly, the economy is still on solid footing. The U.S. Bureau of Economic Analysis estimated that U.S. real GDP grew at an annualized rate of 3.4% in Q3 2026, up from 2.2% in Q2 2026. Consumer spending and business investment continue to drive growth.
When Might the Volatility Ease?
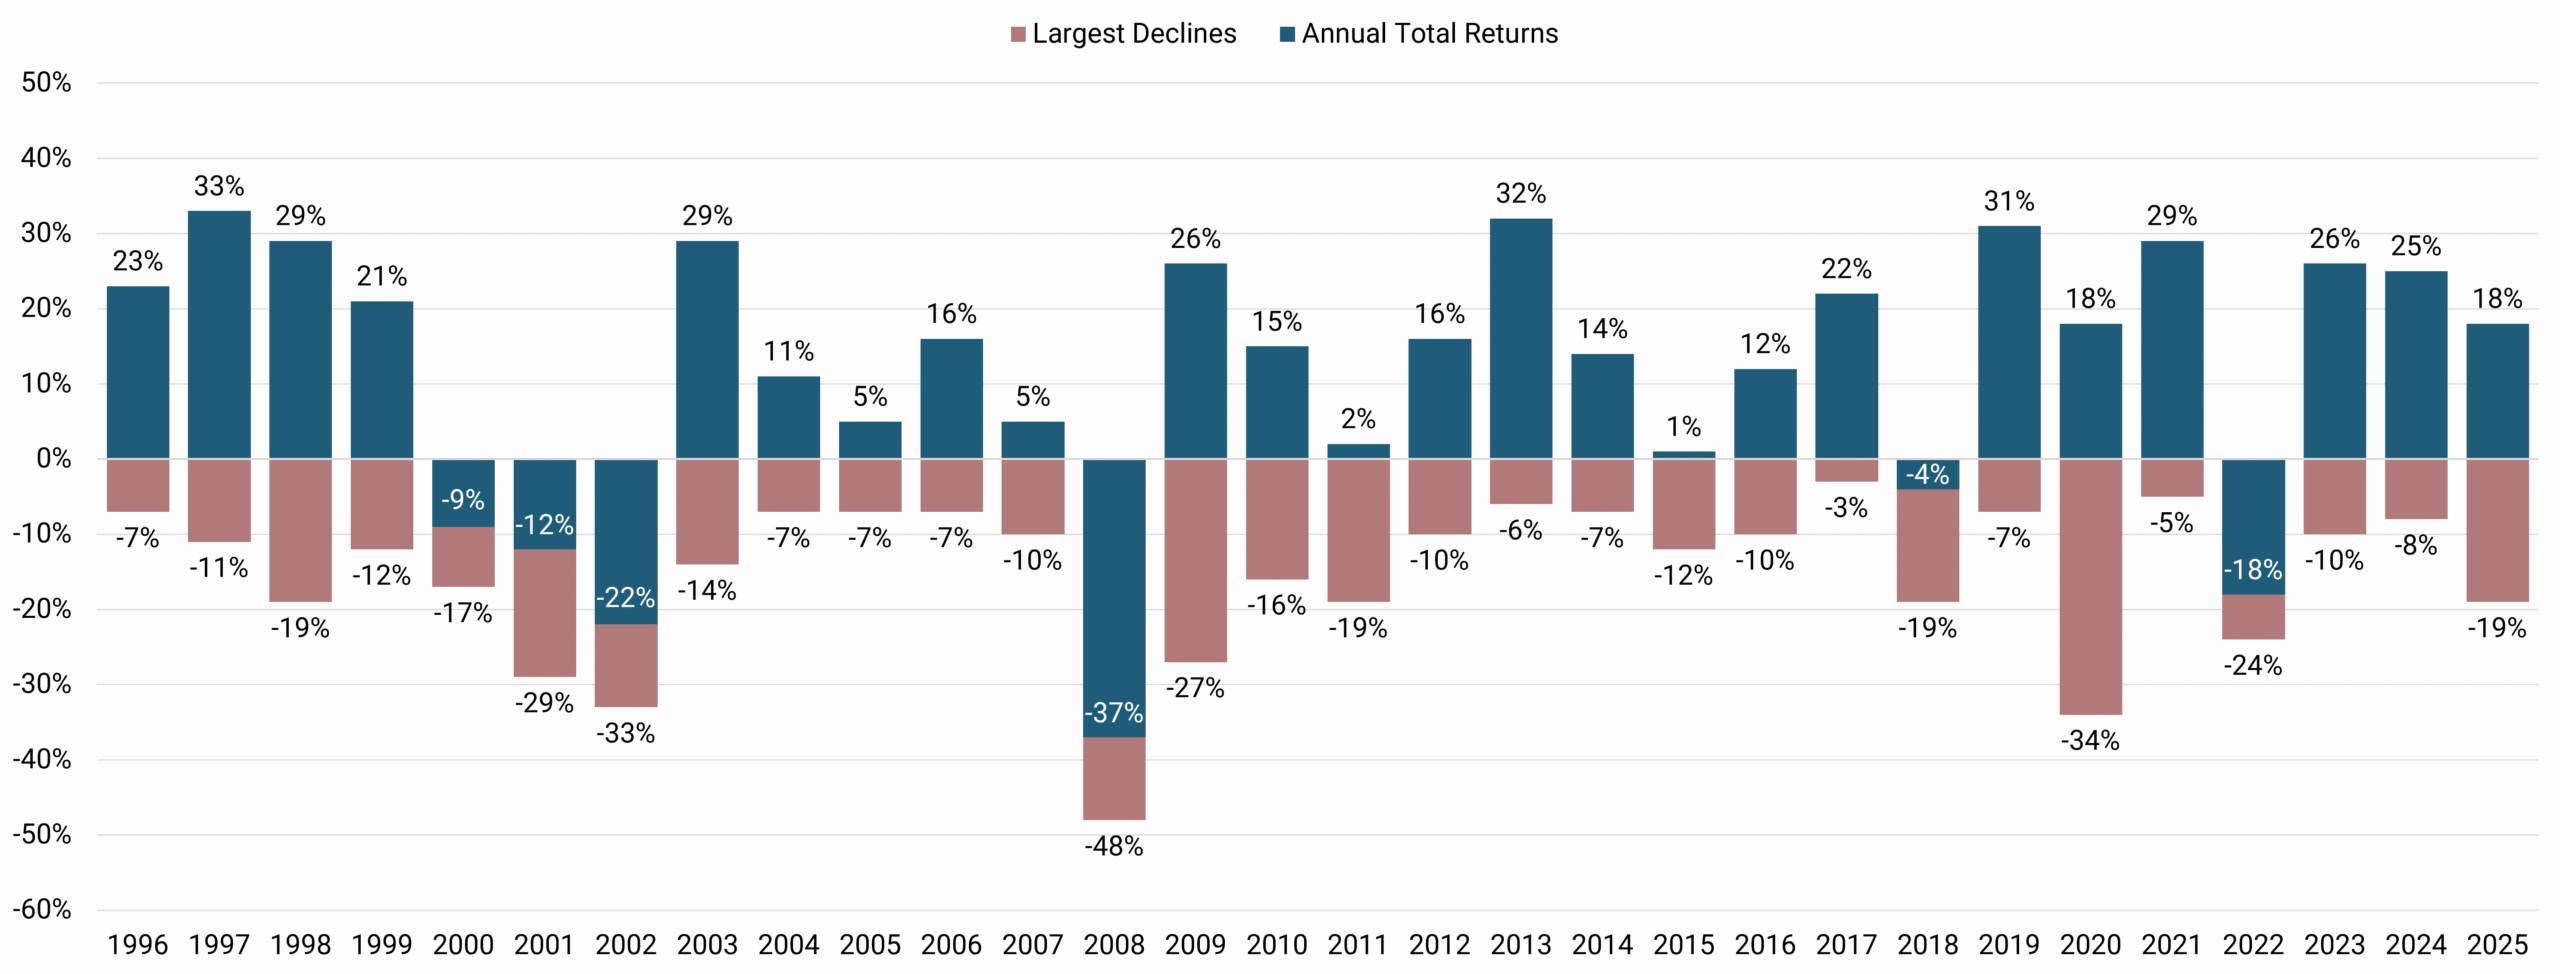
Historically, the S&P 500 has experienced average intra-year declines of roughly 14% since 1990, even as long-term returns have remained positive. Market corrections can last days, weeks, or months, and timelines vary because different catalysts unwind at different speeds. The average correction (10% to 20% decline) lasts 17 days, but any single episode can run shorter or longer depending on whether the decline reflects temporary shifts in expectations or deeper economic stress. The average bear market tends to last much longer, at 1.5 years, although the last two bear markets were much shorter.
U.S. BEAR AND BULL MARKETS SINCE 1920
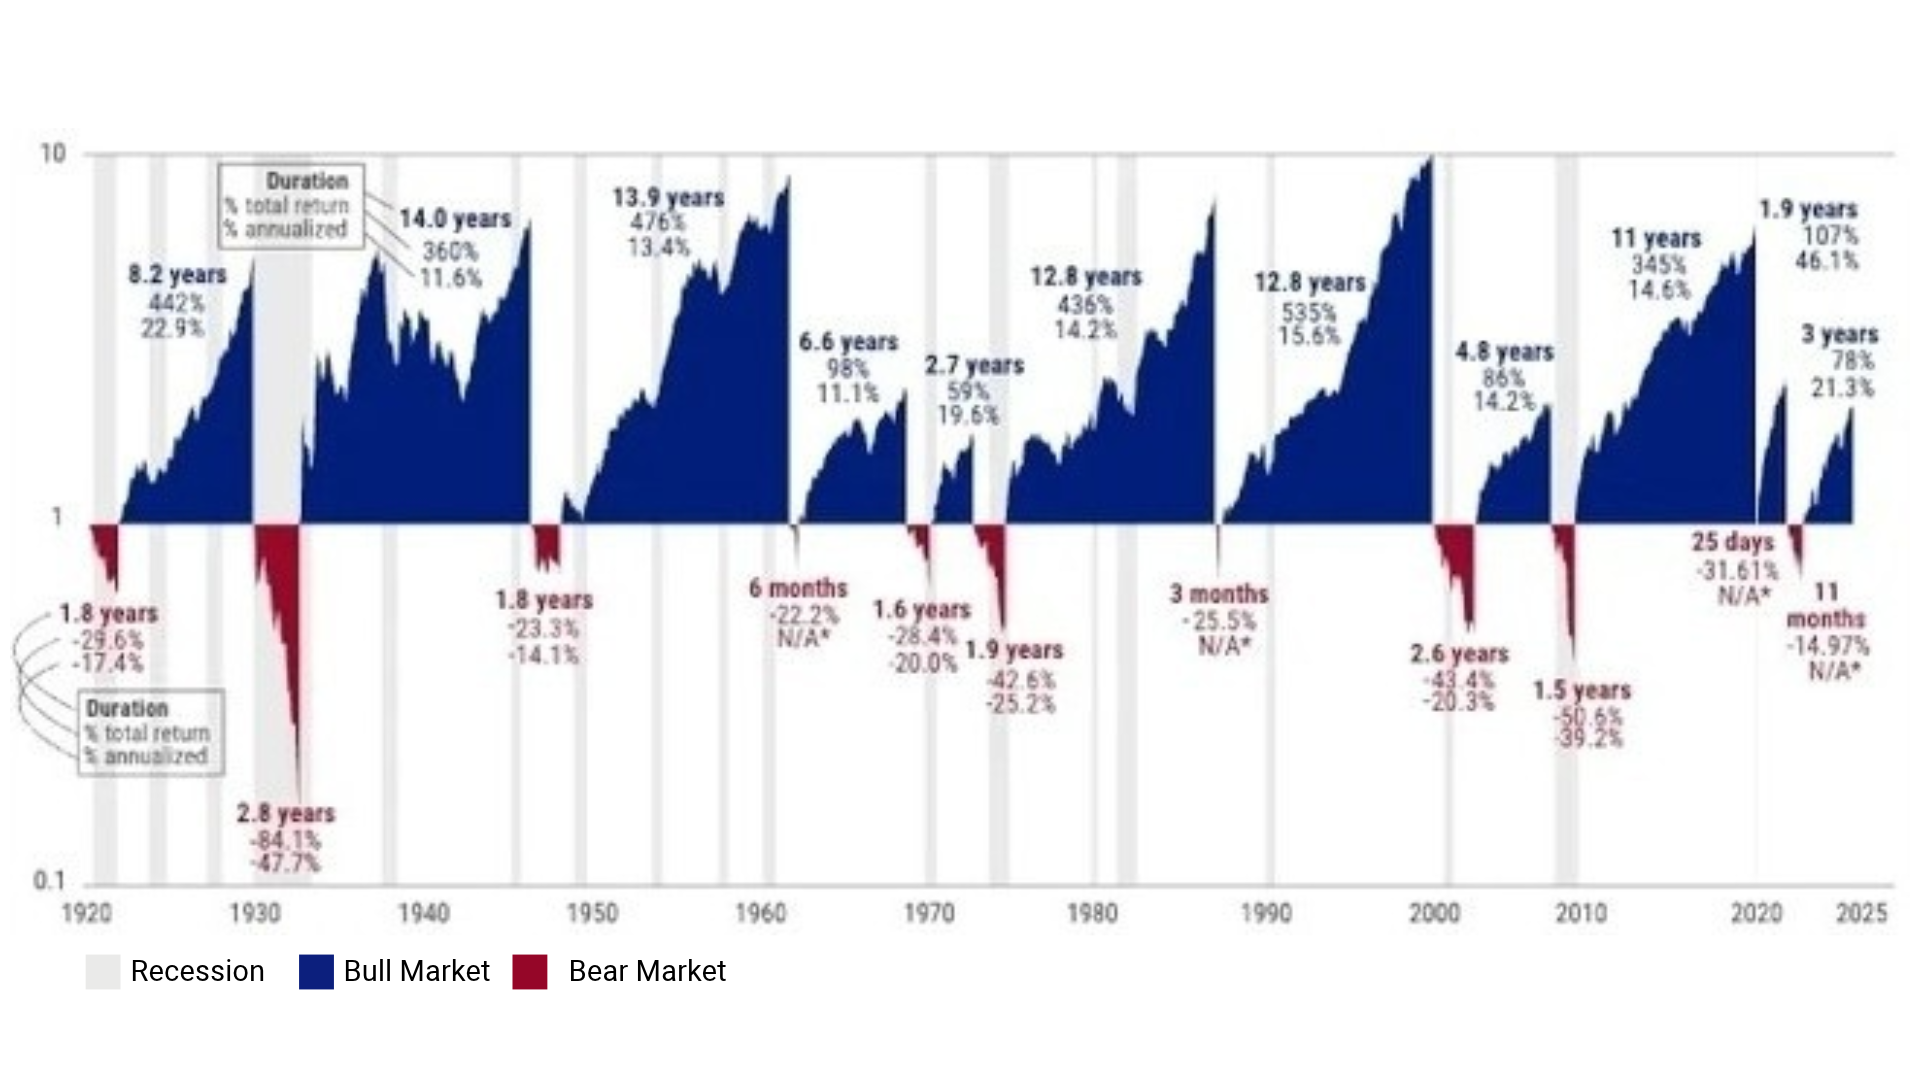
Source: U.S. Bank Asset Management Group analysis, Shiller. Data: S&P 500 Index returns from Jan. 1, 1920–Dec. 31, 2025.
Volatile markets tend to trade on technical indicators and not fundamentals. In the near term, trading momentum can carry more weight than an earnings report. The SPX has fallen below its 200-day moving average – a key technical level. The next technical level was 7,000, which it broke through at the end of the trading session today. After 7,000, the next technical level is ~6,800, which found support earlier this year. It is common for an index to test key technical levels multiple times before finding support.
It is important to remember that past corrections have eventually given way to rallies and new highs, often before the news felt reassuring. From 1996 through 2025, the S&P 500 finished with a positive total return in 24 of 30 calendar years despite declines along the way.
THE U.S. STOCK MARKET’S LARGEST INTRA-YEAR DECLINES VS. YEAR-END TOTAL RETURNS
January 1, 1996-December 31, 2025
 Source: © 2026 Morningstar. All rights reserved.
Periods of volatility test discipline more often than they require a new investment strategy. Warren Buffett once described the stock market as a place where “money is moved from the active to the patient.” We favor investing in companies with healthy balance sheets, dependable cash flow, and strong earnings growth to help weather the storm.
Download a PDF version here.
Sources: Evans May Wealth, Sanctuary Wealth, Hartford Funds, FactSet, NEPC, Franklin Templeton, Warren Buffett, Berkshire Hathaway
Sanctuary Wealth makes no representation as to the accuracy or completeness of information contained herein. Any forward-looking statements are based on assumptions, may not materialize, and are subject to change without notice. The information is based upon data available to the public and is not an offer to sell or solicitation of offers to buy any securities mentioned herein. Any investment discussed may not be suitable for all investors. Investors must make their own decisions based on their specific investment objectives and financial circumstances. Investments are subject to risk, including but not limited to market and interest rate fluctuations. Any performance data represents past performance which is no guarantee of future results. Prices/yields/figures mentioned herein are as of the date noted unless indicated otherwise. All figures subject to market fluctuation and change. Additional information available upon request.