Investing at all-time highs doesn’t seem like a logical strategy when investors’ instincts say, “Buy low, sell high.”
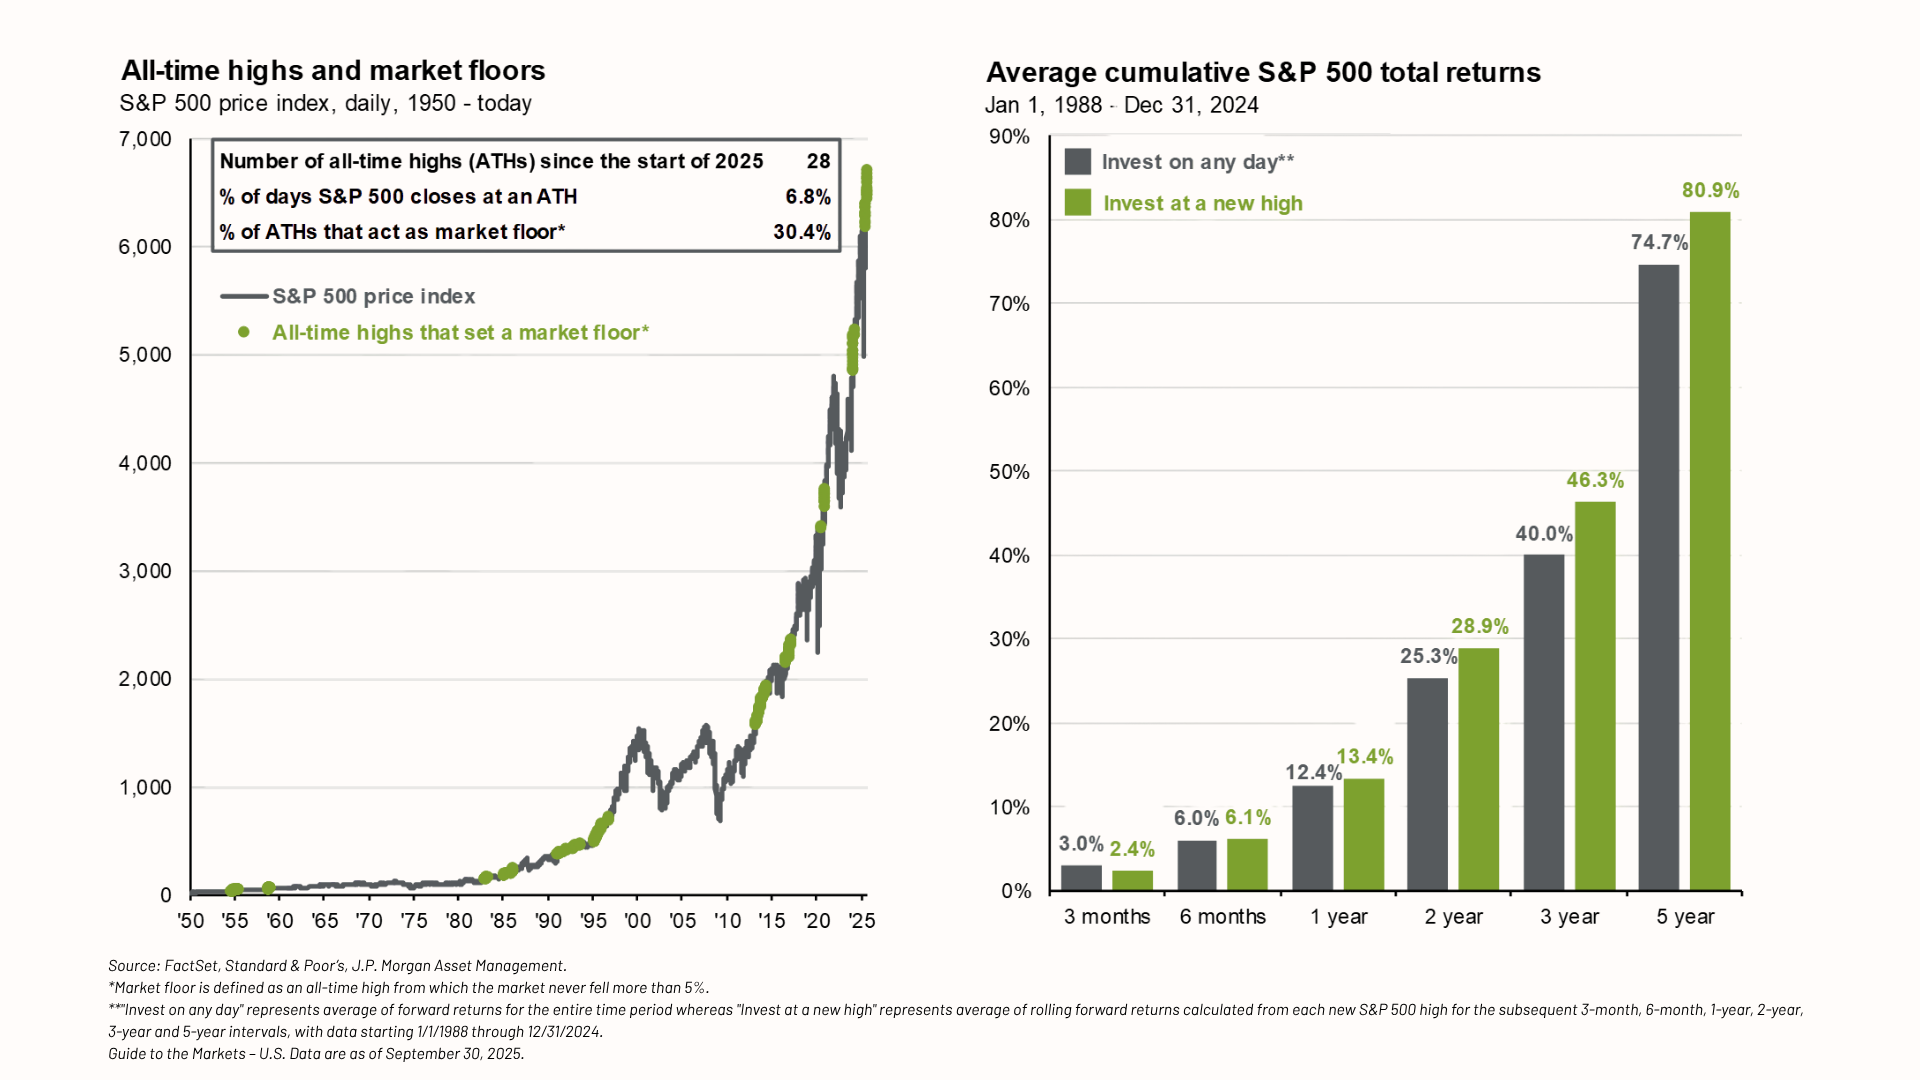
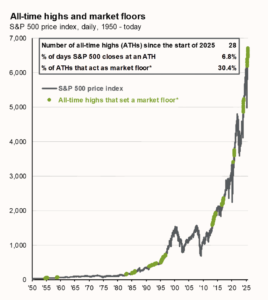
But, the S&P 500 hit new all-time highs 28 times this year (through 9/30/25), following the historical pattern of new highs clustering together.
📊 Chart 1: All-time highs that set a “market floor” since 1950 were followed by further growth in the S&P 500.
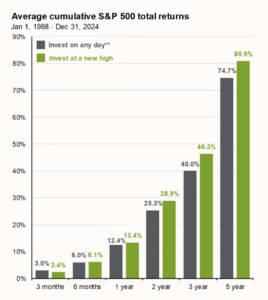
📊 Chart 2: Going back to 1988, we see comparable, or even higher, average S&P 500 total returns when investing at a new high compared to investing on any day.
So, what does this mean?
If investing for the long term, history indicates entering the market near all-time highs can still present opportunities. However, we always stress the importance of a disciplined investment approach focused on fundamentals.
Reach out to us if you’re interested in exploring market entry points for your unique situation.
Source: FactSet, Standard & Poor’s, J.P. Morgan Asset Management.
*Market floor is defined as an all-time high from which the market never fell more than 5%.
**”Invest on any day” represents average of forward returns for the entire time period whereas “Invest at a new high” represents average of rolling forward returns calculated from each new S&P 500 high for the subsequent 3-month, 6-month, 1-year, 2-year, 3-year and 5-year intervals, with data starting 1/1/1988 through 12/31/2024.
Guide to the Markets – U.S. Data are as of September 30, 2025.
#investingstrategies #wealthmanagement #carmelin